
Set up Blackbox Exporter to monitor COS for robotics devices
Warning
Beta Notice: COS for robotics is currently in beta.
Content and features may change, and some functionality may be incomplete or experimental.
Feedback is welcome as we continue to improve.
Blackbox Exporter allows active monitoring of devices and endpoints by probing them over protocols such as HTTP, TCP and ICMP.
This guide explains how to use the blackbox-exporter-k8s-operator charm to monitor a fleet of COS for robotics devices and display their status in a Grafana dashboard.
Blackbox Exporter works by receiving a list of targets to probe and returning metrics about their availability, which can then be scraped by Prometheus and visualized in Grafana.
In this guide, we assume that COS for robotics has been deployed following the instructions available in this tutorial.
Deploy Blackbox Exporter charm
Let’s start by deploying the Blackbox Exporter charm as part of our COS for robotics with:
juju deploy blackbox-exporter-k8s
Verify the deployment status with:
juju status
Relating Blackbox Exporter to COS for robotics charms
Once the blackbox-exporter-k8s app is in active state,
relate it to the following services:
juju relate blackbox-exporter-k8s:self-metrics-endpoint prometheus:metrics-endpoint
juju relate blackbox-exporter-k8s:ingress traefik:ingress
juju relate blackbox-exporter-k8s:catalogue catalogue:catalogue
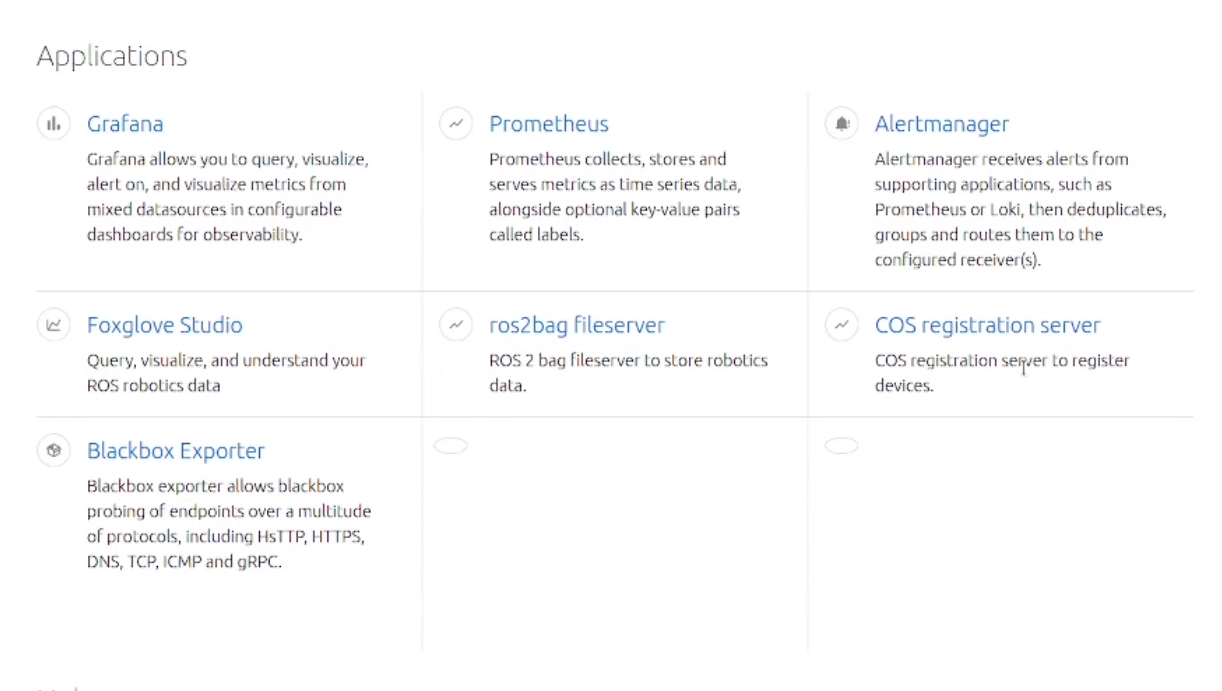
You should now see the blackbox-exporter-k8s app listed in the Catalogue UI as follows:
Probing devices
The COS registration server holds the list of devices to be probed by Blackbox. Any device registered is then automatically targeted by Blackbox for ICMP probing.
To enable this, relate Blackbox Exporter to the registration server as follows:
juju relate blackbox-exporter-k8s:probes cos-registration-server:probes-devices
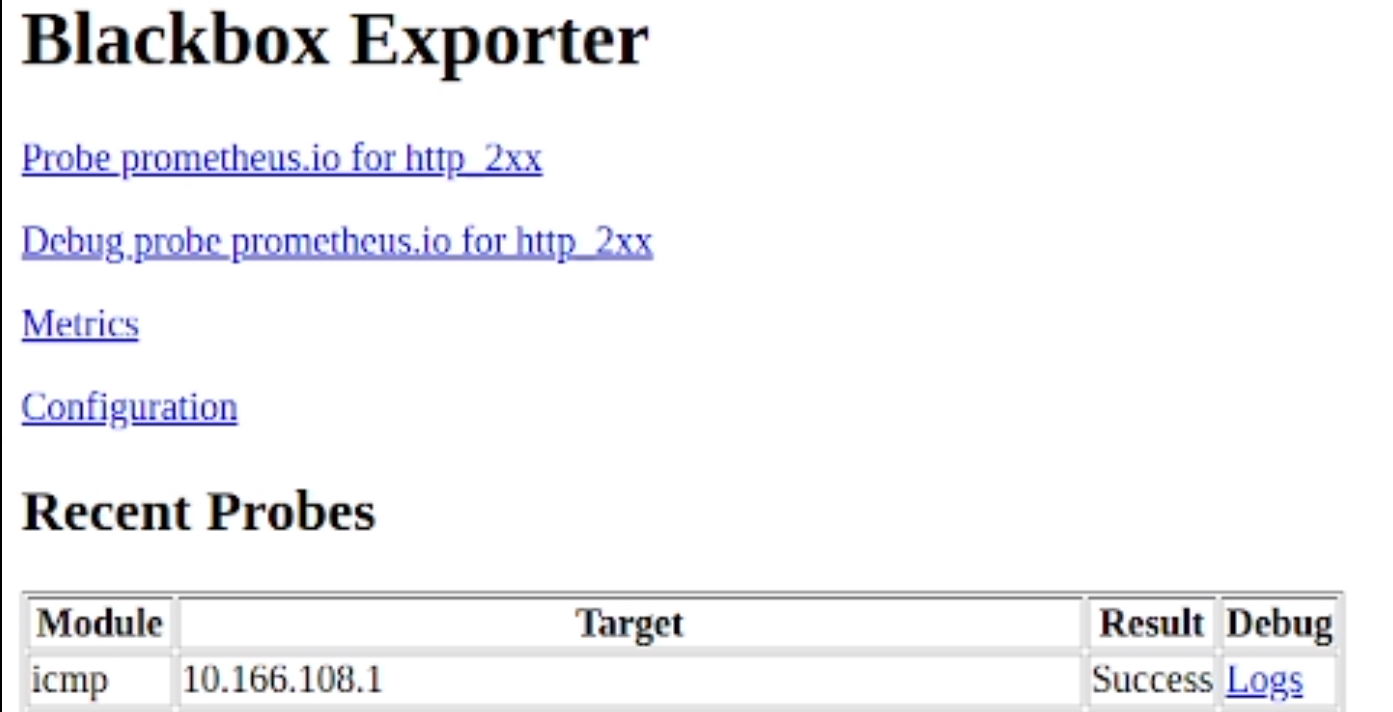
To confirm everything is working, open the Blackbox panel in the Catalogue UI to check the list of probed devices as shown below:
Next, let’s configure a custom Grafana dashboard to visualize the probed devices with labels and status indicators.
Deploy COS configuration charm
By default, the Blackbox Exporter charm includes a standard Grafana dashboard template. However, this dashboard does not include the visualization of devices UUID as labels.
To visualize the status of devices along with their UUID, we are going to use the cos-configuration-k8s operator charm, which enables syncing and applying custom dashboards from a Git repository.
A custom Grafana dashboard template is available at https://github.com/canonical/robotics-cos-k8s-config/blob/feat/blackbox-grafana-dashboard/dashboards/grafana/blackbox/blackbox.json.tmpl.
Let’s now deploy the configuration charm with the appropriate flags to pull in this dashboard:
juju deploy cos-configuration-k8s \
  --config git_repo=https://github.com/ubuntu-robotics/robotics-cos-k8s-config.git \
  --config git_branch=feat/blackbox-grafana-dashboard \
  --config git_depth=1 \
  --config grafana_dashboards_path=/var/lib/juju/agents/unit-cos-configuration-k8s-0/dashboards/grafana/blackbox
Finally, relate the configuration charm to Grafana to visualize the dashboard:
juju relate cos-configuration-k8s grafana
Now, by navigating to Grafana via the Catalogue UI, select the Blackbox Exporter dashboard, and you will see a list of the probed devices with their UUID and the status color:
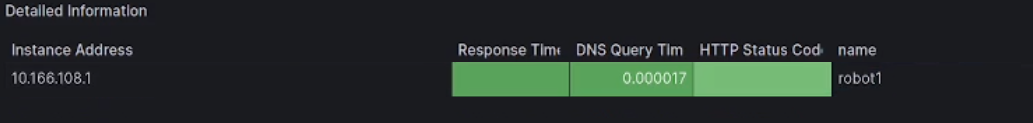
And that’s it! You’re now all set to easily monitor the health of your devices!